This is Part 9 of the AD DFIR Lab series. Part 8 gave us a noisy-ad-current snapshot packed with 2 years of realistic narrative. Part 9 pulls that snapshot out as a forensic image, intact and ready for analysis.
The bridge between “lab ready” and “forensic answers”
After Part 8 finished, the lab had a ZFS snapshot called noisy-ad-current sitting on every VM with ~21k persona-driven activity markers, ~1.3 million EVTX events backdated across 2 years, Prefetch files, NTFS timestamps, the lot. A complete synthetic dataset.
But a snapshot that lives inside Proxmox is not a forensic image. It’s a live block device managed by ZFS. To actually analyze it with tools like masstin, chainsaw, Plaso, Volatility, FTK Imager or Autopsy, you need the disk contents as a file — a raw image, an E01, a VMDK. Something your forensic laptop can read.
So Part 9 is the bridge: how to get each VM’s disk state from the Hetzner Proxmox host to your local analysis machine as a forensic image, with the three usual constraints:
- Consistency — the image must represent a single point-in-time state, not a smeared mix
- No downtime — the lab should keep running; imaging should not force VM shutdowns
- Tight disk budget — the Proxmox host has limited space; you can’t afford to stage a 320 GB raw dump locally before transferring it
The solution that ticks all three boxes turned out to be small and elegant. Let me walk through why, and then show a real benchmark of imaging all 7 lab VMs.
The naive approach that DFIR tutorials usually show
Classic forensic imaging on a running Windows host looks something like this:
# Shut down the VM cleanly
qm shutdown 106
# Wait for it to stop
# ...now dd the block device
dd if=/dev/vm-106-disk bs=16M of=/tmp/vm-106.raw
# Copy to analysis machine
scp /tmp/vm-106.raw me@laptop:/mnt/cases/
Three steps, three problems for our lab:
Problem 1 — forced downtime. Shutting down every VM to image it means the lab goes offline. If you’re trying to simulate an incident response exercise or capture state while something is running, that defeats the point.
Problem 2 — intermediate staging. dd if=... of=/tmp/... writes the whole raw image to Proxmox’s local disk first. For a 50 GB Windows zvol, that’s 50 GB of temporary storage. Multiply by 7 VMs and you need 320 GB of scratch space on the host. The Proxmox root partition on our lab has about 13 GB free. This would instantly fill it and brick the box.
Problem 3 — slow transfer. Uncompressed, 320 GB going over the wire at ~13 MB/s (the sustained bandwidth we measured) would take 6.8 hours. That’s unreasonable for a workflow you want to run before every attack session.
So, clearly, not this. Let me show the approach that works.
The real approach: ZFS snapshots, clones, streaming compression
Two primitives from ZFS do the heavy lifting.
Primitive 1 — ZFS snapshots are read-only, point-in-time views of a zvol. We already have this from Phase 10: noisy-ad-current is a snapshot of each VM’s disk captured at a specific moment. The VM keeps writing to its live state after the snapshot was taken, but the snapshot itself is frozen and cannot be changed. This is exactly the “consistency” property forensics needs — no smearing, no partial updates. Taking a filesystem at the moment of a ZFS snapshot is equivalent to the “pull the plug” image of a running host at that moment, without actually pulling any plug.
Primitive 2 — ZFS clones of snapshots are instant and essentially free. A ZFS clone takes a snapshot and exposes it as a new writable zvol, sharing blocks with the snapshot via copy-on-write. Creating a clone is an O(1) metadata operation — milliseconds, zero extra disk.
# Clone the snapshot into a new device
zfs clone vmstore/images/vm-106-disk-0@noisy-ad-current \
          vmstore/images/vm-106-forensic-tmp

# Now /dev/zvol/vmstore/images/vm-106-forensic-tmp exists as a block device
# containing exactly the snapshot's state
ls -l /dev/zvol/vmstore/images/vm-106-forensic-tmp
# -> brw-rw---- 1 root disk 230, 8 Apr 15 02:29 /dev/zvol/...
Putting these together: to get a consistent image of a VM without touching the live disk, we clone the snapshot → read the clone with dd → destroy the clone. The live VM never notices. No downtime.
And instead of dumping to a scratch file on the Proxmox host, we pipe the dd output through zstd (compression) through SSH (network transport) and land it directly on the analyst laptop’s disk. The Proxmox host reads blocks from ZFS, compresses them on the fly, sends them through the tunnel, and never writes anything to its own filesystem during the dump. Zero footprint on Hetzner.
# From the analyst laptop:
ssh root@hetzner "
    zfs clone vmstore/images/vm-106-disk-0@noisy-ad-current \
              vmstore/images/vm-106-forensic-tmp
    dd if=/dev/zvol/vmstore/images/vm-106-forensic-tmp bs=16M status=none \
      | zstd -T0 -10
    zfs destroy vmstore/images/vm-106-forensic-tmp
" > /mnt/forensic/vm-106-ws01.raw.zst
That’s the whole technique in one command. The rest of the post explains why we chose each piece.
Why raw + zstd and not E01 / qcow2 / VMDK
masstin — the tool I wrote for lateral-movement forensics — handles four image formats natively. I checked with a real 109-image case to make sure:
=> Image 2/109: GUR00250622D.dd  (DD, 119.2 GB)        ← raw dd
=> Image 3/109: E01Capture.E01   (E01, 3.9 GB)         ← EnCase/libewf
=> Image 4/109: STFDC01_2016.vmdk (VMDK, 100.0 GB)     ← VMware
=> Image 46/109: win10-2004.vmdk (VMDK, 60.0 GB)
So the choice of format is not a masstin constraint — it’s about size, speed, and operational simplicity. Here’s what the alternatives look like for a 50 GB Windows zvol with ~10 GB used:
| Format | Size | Time | masstin | Notes |
|---|---|---|---|---|
| dd uncompressed | 50 GB | ~50s on disk | ✓ | Unusable over the wire |
| raw + zstd -10 | ~5 GB | ~7 min | ✓ | Chosen |
| raw + zstd -19 | ~3.5 GB | ~14 min | ✓ | Only worth it on fast links |
| qcow2 compressed | ~5 GB | ~2 min | ✗ | Needs conversion for some tools |
| E01 default | ~5.5 GB | ~5 min | ✓ | Slightly larger |
| E01 max compression | ~5 GB | ~10 min | ✓ | Same size as zstd, 3x slower |
zstd -10 wins on every axis except chain-of-custody metadata. The catch is that E01 has SHA1 hashes baked in as part of the file format, with metadata about the acquisition tool, timestamps and operator. If you’re imaging a real machine that might end up in court, that matters. For a training lab, it’s noise.
I went with raw + zstd for two practical reasons:
-
zstd’s compression algorithm is objectively better than E01’s zlib for this workload. zlib is from 1995. zstd is from 2015. Same input, zstd produces a smaller output, faster, on all common datasets. Our Windows Server zvols compress to ~13% of their
volsizewith zstd -10. zlib in E01 at max compression plateaus at ~10%, but takes 3-5x longer to get there. -
raw is universal. Every forensic tool on the planet opens
dd.raw. You canlosetupit,mmlsit,flsit, hand it to Autopsy, chainsaw, masstin, X-Ways, FTK Imager. Zero conversion. E01 and VMDK require format-aware tools..raw.zstdecompresses with a singlezstd -dcommand and then it’s just a disk image.
If a specific case later demands E01 metadata, libewf-utils includes ewfacquire, which can read from the same ZFS clone device and produce an E01 with proper acquisition metadata. That’s a 10-line addition to the script when we need it.
The script
scripts/lab-forensic-dump.sh. Three subcommands:
lab-forensic-dump.sh estimate [vmid ...]
    Predict dump sizes (no I/O on block devices)

lab-forensic-dump.sh dump <vmid> <snapshot> [--level N]
    Stream raw+zstd to stdout (for SSH pipe usage)

lab-forensic-dump.sh local <vmid> <snapshot> <output> [--level N]
    Write to a local file on Proxmox + SHA256 sidecar
The dump subcommand is the interesting one because it’s the piece that runs inside the SSH tunnel. It’s built to have zero footprint on the Proxmox host side: the clone is ZFS-cheap, the dd pipe never writes to disk on Proxmox, and the clone is destroyed via a bash trap regardless of how the function exits (success, error, or signal interrupt).
Here’s the core of the script:
do_dump() {
    local vmid="$1"
    local snap="$2"
    local level="$3"

    local source="${POOL}/vm-${vmid}-disk-0@${snap}"
    zfs list -H -t snapshot "$source" >/dev/null 2>&1 \
        || die "snapshot not found: $source"

    # Fixed name per VM so orphan clones from previous crashes get reused
    local clone="${POOL}/vm-${vmid}-forensic-tmp"

    # Destroy stale clone if present (previous run died before cleanup)
    if zfs list -H "$clone" >/dev/null 2>&1; then
        log "removing stale clone: $clone"
        zfs destroy "$clone" || die "couldn't destroy stale clone"
    fi

    log "cloning $source -> $clone"
    zfs clone "$source" "$clone" || die "zfs clone failed"
    CLONE="$clone"     # register for EXIT trap cleanup

    local zvol_device="/dev/zvol/${clone}"
    # Wait for udev to create the device node (up to 10s)
    for _ in $(seq 1 20); do
        [ -b "$zvol_device" ] && break
        sleep 0.5
    done

    log "dumping $zvol_device with zstd -T0 -${level}"
    dd if="$zvol_device" bs="16M" status=none 2>/dev/null \
        | zstd -T0 "-${level}" --quiet

    local rc zst_rc
    rc=${PIPESTATUS[0]}
    zst_rc=${PIPESTATUS[1]:-0}

    zfs destroy "$clone" 2>/dev/null || true
    CLONE=""

    [ "$rc" -eq 0 ] && [ "$zst_rc" -eq 0 ] || die "dump failed rc=$rc zst=$zst_rc"
}
A couple of details worth mentioning:
-
Fixed clone name (
vm-${vmid}-forensic-tmp) instead of a PID-based name. This means if a previous run died mid-dump and left a clone behind, the next run just destroys it and starts fresh. PID-based names would accumulate forever. -
PIPESTATUS[0]andPIPESTATUS[1]captured in a single statement. Bash’sPIPESTATUSarray is reset by every command, includinglocal. If you write twolocaldeclarations back to back, the second one findsPIPESTATUSempty and underset -ubash errors out with “unbound variable”. The fix is to capture both values into pre-declared local vars first, or use a single assignment. I had to learn this the hard way on the first test run. -
Trap cleanup at the script level:
CLONE=""
cleanup_clone() {
    [ -n "$CLONE" ] && zfs destroy "$CLONE" 2>/dev/null
}
trap cleanup_clone EXIT INT TERM
Whatever happens — clean exit, error, Ctrl+C, SIGTERM — the trap runs and destroys any clone we’re still tracking. This is the difference between “there’s always an orphan clone somewhere” and “there’s never an orphan clone”.
The estimate subcommand
Before you dump, you want to know how much space the output will need on the analyst laptop. ZFS tells us this directly:
zfs get -Hp volsize,referenced vmstore/images/vm-101-disk-0
volsize= what the VM sees as its disk (50 GB for our Windows VMs)referenced= actual allocated data (much smaller, because thin-provisioned)
From these we can predict the compressed size with a simple ratio. Initially I thought referenced × 0.4 based on folklore about zstd ratios for general data. The real benchmark showed that was wrong — for our Windows Server VMs with 2 years of phase10 activity, the real ratio is closer to 0.7.
Why higher than my guess? Because the EVTX files we generated have high entropy. Every event has a unique timestamp (to the microsecond), unique Event Record IDs, unique GUIDs in many fields, user SIDs, machine SIDs. That’s information the compressor can’t squeeze. The NTFS metadata and Windows system files compress reasonably well (~50-60%), but the generated noise is basically uncompressible.
Linux comes out at ~0.6 because ext4 is denser and there’s less entropy in the generated activity.
The estimate now uses used × 0.7 universally. It over-predicts Linux slightly (safer than under-predicting) and matches Windows accurately:
VMID   NAME                       VOLSIZE       USED     EST-ZST
----------------------------------------------------------------------
101    DC01-kingslanding             50GB      8.0GB       ~5.6GB
102    DC02-winterfell               50GB      8.1GB       ~5.7GB
103    SRV02-castelblack             50GB       12GB       ~8.1GB
104    DC03-meereen                  50GB      8.7GB       ~6.1GB
105    SRV03-braavos                 50GB      9.3GB       ~6.5GB
106    WS01-highgarden               50GB       14GB       ~9.4GB
107    LNX01-oldtown                 20GB      1.4GB       ~940MB
----------------------------------------------------------------------
TOTAL                               320GB       60GB         ~42GB
320 GB of volsize, 60 GB of referenced, ~42 GB compressed. The compression ratio against volsize is ~13%, which means we shrink the wire traffic from “too slow to be practical” to “finishes in a lunch break”.
The real benchmark — all 7 VMs imaged in one session
I ran the full pipeline end-to-end on 2026-04-15, streaming each VM through SSH from Hetzner (95.217.226.229, Germany) to a forensic disk on my laptop in Spain. The loop:
OUTDIR="/i/forensic/lab-$(date -u +%Y-%m-%d)"
mkdir -p "$OUTDIR"

for vm in 101 102 103 104 105 106 107; do
    ssh root@95.217.226.229 \
        "/root/lab/scripts/lab-forensic-dump.sh dump $vm noisy-ad-current" \
        > "$OUTDIR/vm-${vm}.raw.zst"
done
Results:
| VM | Name | Compressed | Time | Throughput |
|---|---|---|---|---|
| 101 | DC01-kingslanding | 5.4 GB | 6m 40s | 13 MB/s |
| 102 | DC02-winterfell | 5.5 GB | 7m 00s | 13 MB/s |
| 103 | SRV02-castelblack | 8.0 GB | 9m 45s | 13 MB/s |
| 104 | DC03-meereen | 5.8 GB | 7m 10s | 13 MB/s |
| 105 | SRV03-braavos | 6.4 GB | 8m 11s | 13 MB/s |
| 106 | WS01-highgarden | 9.8 GB | 12m 11s | 13 MB/s |
| 107 | LNX01-oldtown | 840 MB | 1m 33s | 9 MB/s |
| Total | 42 GB | 52m 34s |
SHA256 of each compressed file captured in hashes.sha256, timestamps logged to benchmark.log. The whole thing took 52 minutes and 34 seconds, end-to-end, with my laptop doing nothing during the wait.
Three observations from the real run.
The bottleneck is the network, not the CPU
Every Windows VM rendered at exactly 13 MB/s — that’s ~100 Mbit/s sustained. The clone is instant, the dd reads ZFS at >1 GB/s (NVMe), and zstd -T0 -10 multithreaded runs at ~500 MB/s on the Proxmox host’s CPU. So the CPU is idle for 95% of the dump. The only thing actually working hard is the SSH tunnel piping the compressed bytes across the Internet to my laptop.
This matters for tuning. Cranking zstd up to -19 would not make the dump faster. It would just make the compressed stream smaller, but since we’re already limited by the network speed and not by how fast Proxmox can push bytes, spending extra CPU cycles on better compression doesn’t help the wall clock time at all. It would only help on a symmetric 1 Gbit+ link where zstd becomes the bottleneck rather than the pipe.
If you’re on a faster link than I was (colo host, fiber to fiber, 200+ Mbit/s), you’d want to reconsider. At my 100 Mbit/s link, -10 is fine.
Windows Server VMs cluster around 6 GB, WS01 and SRV02 are outliers
The three DCs (101, 102, 104) came out at 5.4-5.8 GB. The ADCS server (105) at 6.4 GB. SRV02 (103) at 8.0 GB, and WS01 (106) at 9.8 GB.
The ranking reflects how much Phase 10 activity touched each VM:
- WS01 is the heaviest because it’s the only Windows 10 workstation, and jon.snow used it every workday for 2 simulated years. Two years of Prefetch, user profile state, Chrome process traces, user hive growth. A workstation accumulates far more distinct content than a DC does.
- SRV02 is second because it hosts 4 human personas plus the system.backup job — every day of the narrative generated multiple events per round on this VM from 5 different users. It also runs IIS and MSSQL in the background.
- The DCs get only
system.replicationfor their respective domains + a couple of cross-forest auths. Similar volume per DC. - SRV03 (ADCS) gets system.adcs every round but nothing else.
- LNX01 is tiny because its volsize is 20 GB (vs 50 on Windows) and Linux packs its files densely with less empty space.
This is a good validation signal that Phase 10 generated the activity distribution I designed into personas.yaml. The sizes are proportional to the persona count and per-persona activity load for each VM.
The hashes file got cut off mid-write on the first run
Small operational lesson. My benchmark script’s final step was:
echo "=== SHA256 ===" >> "$BENCH"
cd "$OUTDIR" && sha256sum *.raw.zst | tee hashes.sha256
The tee redirection creates hashes.sha256 but writes are line-buffered in most shells. If I read the file too early, I see only the first few lines. That’s what happened on the first check: 4 of 7 hashes in the file even though the benchmark.log already had all 7.
Re-running sha256sum directly produced the complete file. Not a real bug, just timing. But a useful reminder that “the task completed” notification and “all intermediate files are fully flushed to disk” are not exactly the same moment.
What’s on the laptop now
/i/forensic/lab-2026-04-15/
├── benchmark.log          1.8 KB  (full session log with timings)
├── hashes.sha256          620 B   (7 SHA256 hashes, verified)
├── vm-101.raw.zst         5.4 GB
├── vm-101.stderr          247 B   (sidecar log from Proxmox-side script)
├── vm-102.raw.zst         5.5 GB
├── vm-102.stderr          247 B
├── vm-103.raw.zst         8.0 GB
├── vm-103.stderr          247 B
├── vm-104.raw.zst         5.8 GB
├── vm-104.stderr          247 B
├── vm-105.raw.zst         6.4 GB
├── vm-105.stderr          247 B
├── vm-106.raw.zst         9.8 GB
├── vm-106.stderr          247 B
├── vm-107.raw.zst         840 MB
└── vm-107.stderr          202 B
42 GB total. The laptop disk has 780 GB still free, so there’s plenty of room to decompress, process, and keep both the .zst archive and the extracted .raw files side by side.
Next step is to decompress and run masstin bulk analysis:
cd /i/forensic/lab-2026-04-15

# Decompress in place, removing the .zst after each file to keep the
# peak disk footprint flat rather than doubled
for f in *.raw.zst; do
    zstd -d --rm "$f"
done

# Run masstin across the whole directory
masstin -a parse-massive -d . -o masstin-output.csv --overwrite
That produces one unified CSV with all the lateral-movement events masstin can extract across the 7 images: logons, SMB sessions, WinRM/WMI/PsExec traces, Kerberos tickets, MountPoints2 registry writes, scheduled task remote triggers, and the rest of the toolkit. In our case: 256,237 events across 30+ user accounts spanning all 3 domains.
The output is designed to be loaded into Neo4j or Memgraph for graph-based hunting. Here’s the result of loading the full lab timeline into Memgraph — each node is a machine, each edge an authentication or lateral connection:
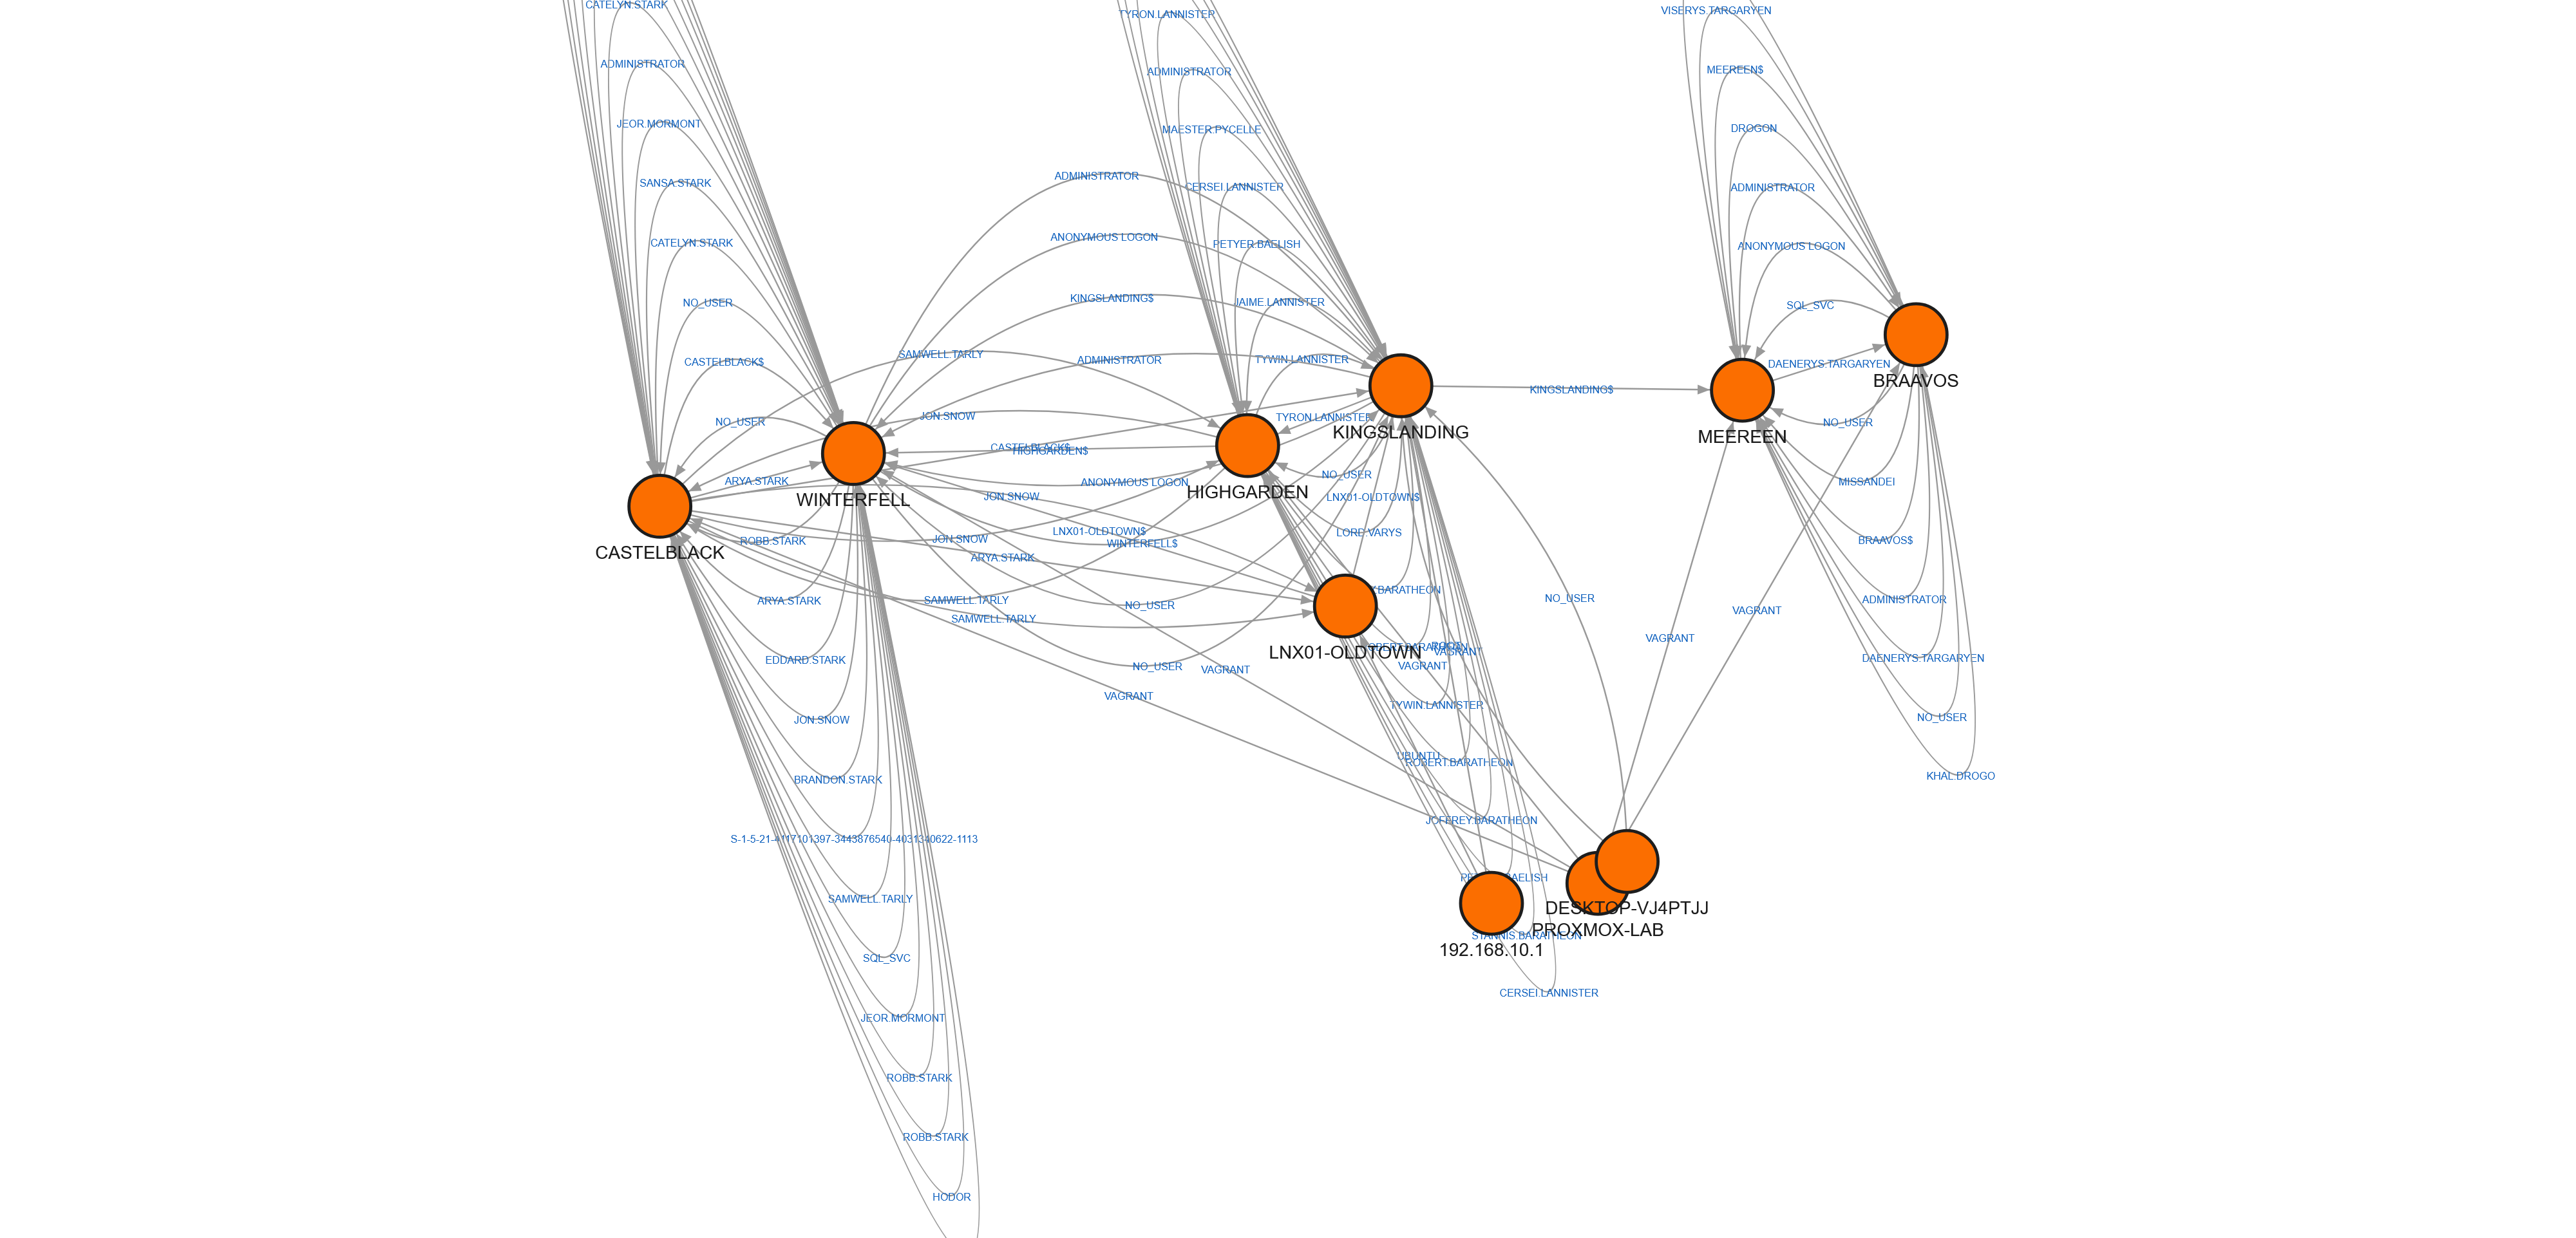
The dense clusters at the top are the Domain Controllers — thousands of cross-domain Kerberos authentications between the three domains. The nodes with fewer edges below are the member workstations and servers. This is the real topology of two years of simulated corporate activity, ready for an attacker to leave their footprint on top.
But that’s Part 10. Part 9 ends here, with a validated pipeline and a real dataset sitting on my desk.
What’s next
Part 10 — “Fire and Blood: Attack Scenarios and Forensic Analysis” — will run attacks from Kali on a fresh noisy-ad-current rollback, re-image with this pipeline, and let masstin chew through the before/after pair to see which artifacts actually catch the attacker.
The imaging pipeline is the tool. The attacks are what makes it useful.
Next: Part 10 — Fire and Blood: Attack Scenarios and Forensic Analysis (coming soon)
Previous: Part 8 — A Day in the Realm: Generating Two Years of Historical Noise
$ comments